- View more resources from this publisher
 University of Nottingham
Tooltip
These resources have been reviewed and selected by STEM Learning’s team of education specialists for factual accuracy and relevance to teaching STEM subjects in UK schools.
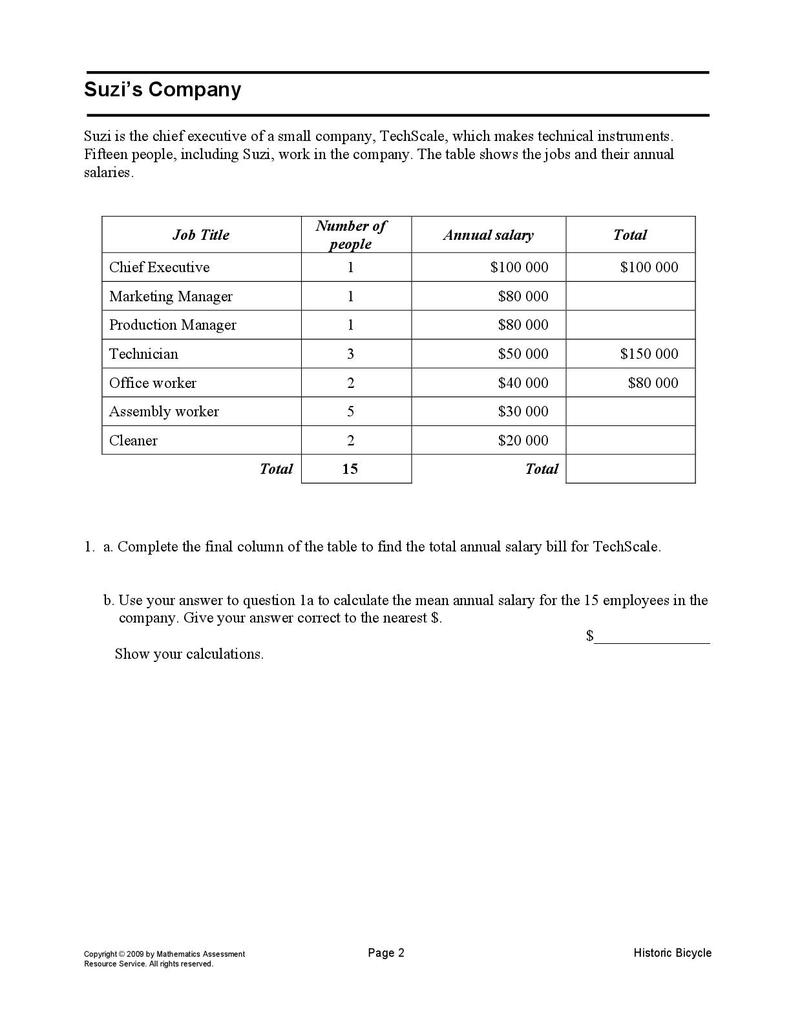
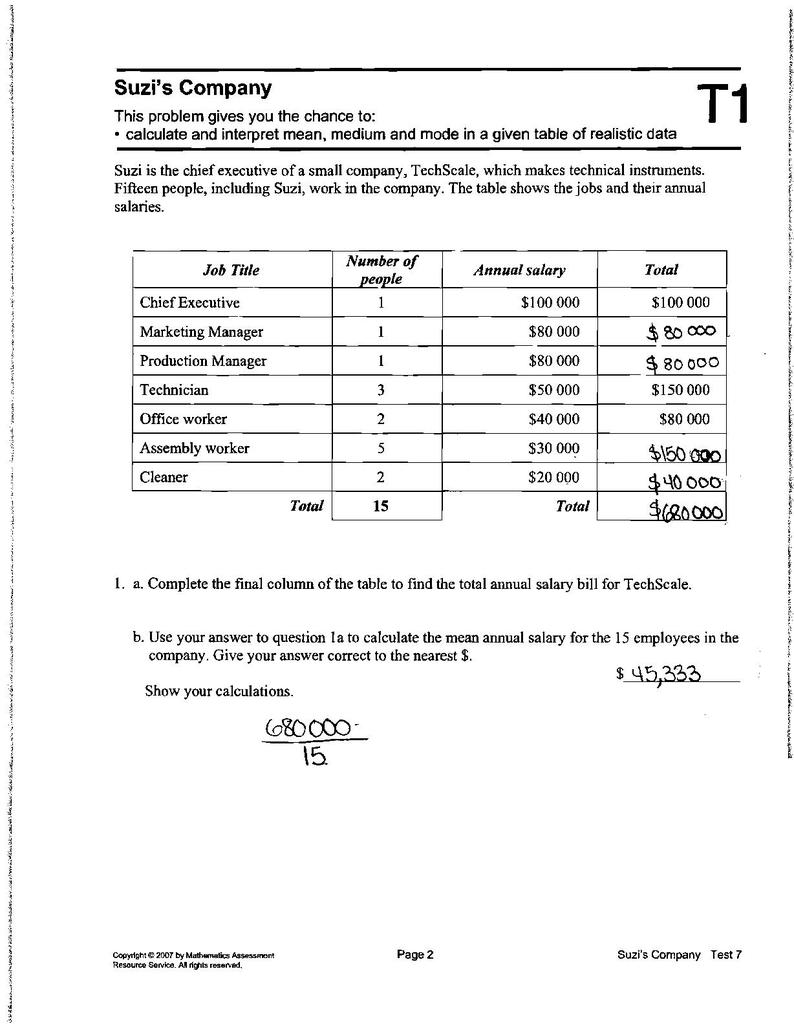
Suzi’s company: frequency tables
This task is designed to assess how well students understand:
- Calculating the mean from a frequency table
- Working out the mode from a frequency table
- Using statistical measures to justify a statement
The task looks at salaries in a small company. Information on salaries is presented in the form of a frequency table. Students must calculate the mean, mode and median from the table. They then use their answers to justify different statements. The final task is to look at the effect of removing one of the pieces of data.
This task is from the Mathematics Assessment Resource Service, a collaboration between UC Berkeley and the Shell Centre team at the University of Nottingham. A full rubric is given for the task, together with examples of student work and suggestions for helping students overcome misconceptions. Further information on the collection is given here.
Show health and safety information
Please be aware that resources have been published on the website in the form that they were originally supplied. This means that procedures reflect general practice and standards applicable at the time resources were produced and cannot be assumed to be acceptable today. Website users are fully responsible for ensuring that any activity, including practical work, which they carry out is in accordance with current regulations related to health and safety and that an appropriate risk assessment has been carried out.
Downloads
-
Suzis company - student notes 82.88 KB
-
Suzis company - student work 788.11 KB
-
Suzis company - marked student work 600.77 KB
Show downloads
-
 Suzis company - student notes 82.88 KB
 -
Suzis company - student work 788.11 KB
-
Suzis company - marked student work 600.77 KB
-
Download all files as a .zip1.48 MB
Information on the permitted use of this resource is covered by the Category Three Content section in STEM Learning’s Terms and conditions.


