- View more resources from this publisher
 University of Nottingham
Tooltip
These resources have been reviewed and selected by STEM Learning’s team of education specialists for factual accuracy and relevance to teaching STEM subjects in UK schools.
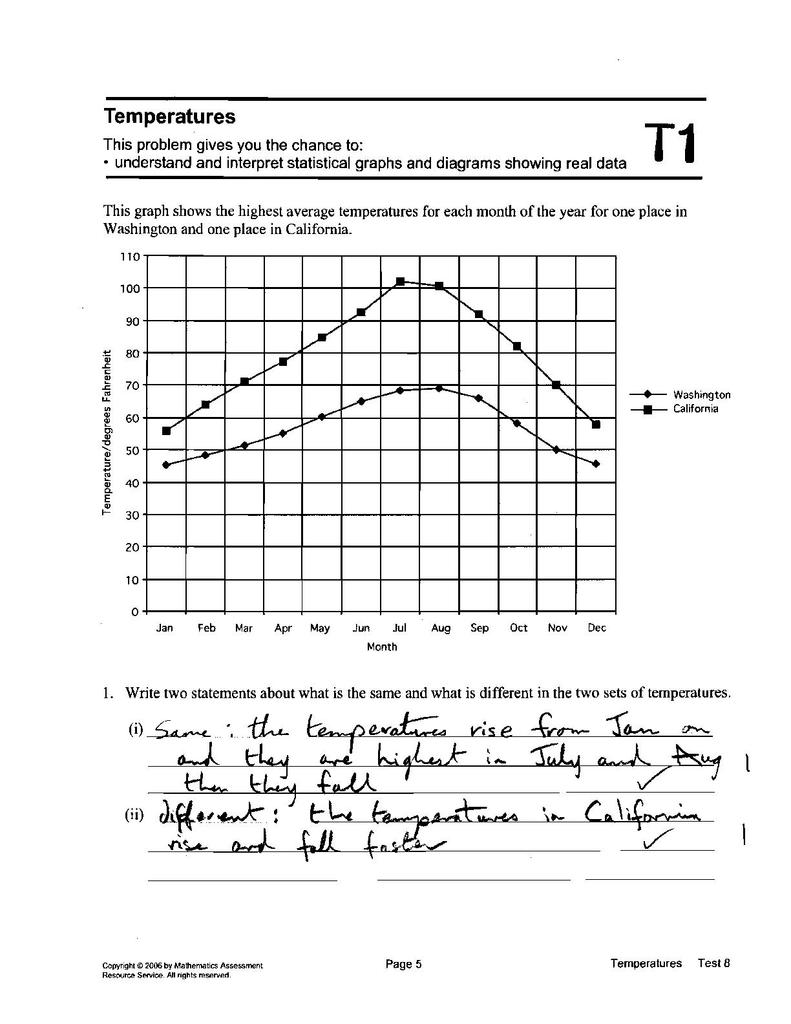
Temperatures: graphs and box plots
This task assesses understanding of graphs and box plots.
A graph is given that shows the highest average temperature for each month in California and Washington. The task is to say what is the same about the graphs, and what is different. A subsequent task is to select correct box plots for California and Washington.
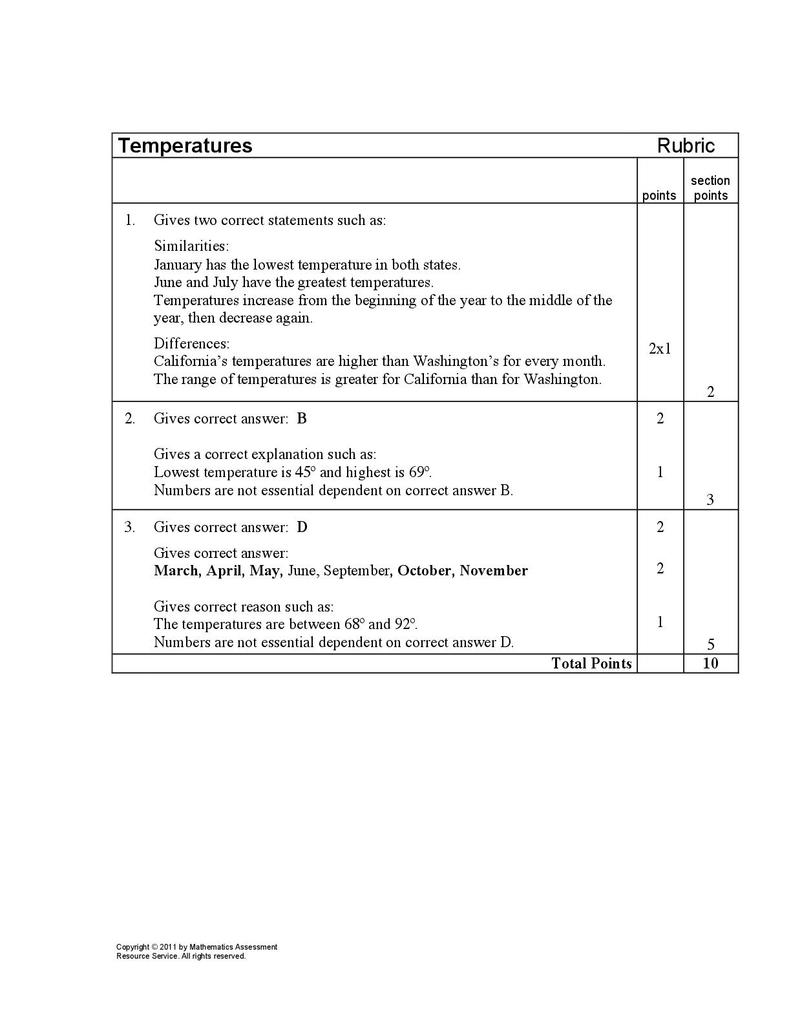
This task is from the Mathematics Assessment Resource Service, a collaboration between UC Berkeley and the Shell Centre team at the University of Nottingham. A full rubric is given for the task, together with examples of student work and suggestions for helping students overcome misconceptions. Further information on the collection is given here.
Show health and safety information
Please be aware that resources have been published on the website in the form that they were originally supplied. This means that procedures reflect general practice and standards applicable at the time resources were produced and cannot be assumed to be acceptable today. Website users are fully responsible for ensuring that any activity, including practical work, which they carry out is in accordance with current regulations related to health and safety and that an appropriate risk assessment has been carried out.
Downloads
-
Temperatures - student notes 79.36 KB
-
Temperatures - student work 1.65 MB
-
Temperatures - marked student work 978.97 KB
-
Temperatures - rubric assessment 84.06 KB
Show downloads
-
 Temperatures - student notes 79.36 KB
 -
Temperatures - student work 1.65 MB
-
Temperatures - marked student work 978.97 KB
-
Temperatures - rubric assessment 84.06 KB
Download all files as a .zip2.72 MB
Information on the permitted use of this resource is covered by the Category Three Content section in STEM Learning’s Terms and conditions.


